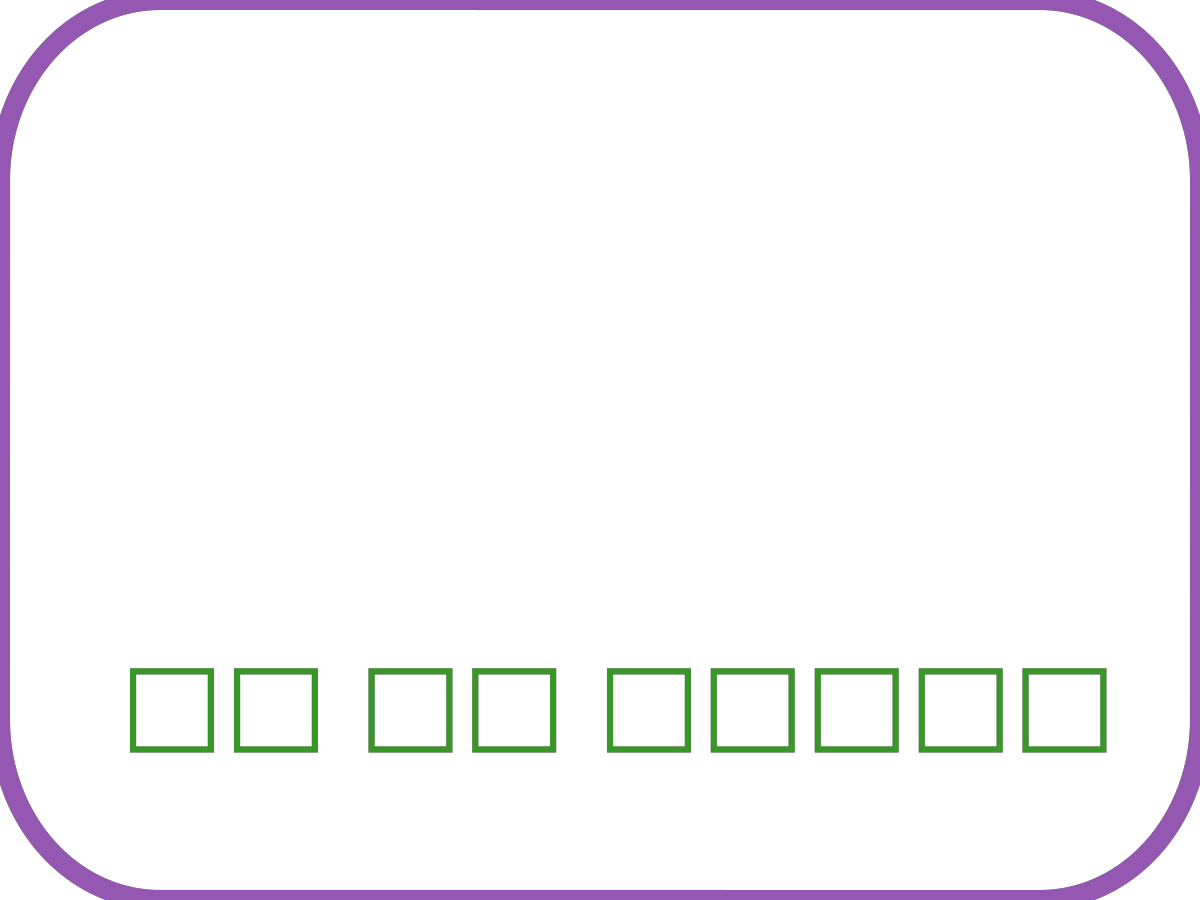
In this demo, we will create the logo for this package (OhMyCards.jl) with Makie! The initial idea for the logo was to have a card with some picture or plot in the background, and indistinct title text in the foreground.
Setup

First, we import all the packages we will need to draw the logo. We will be drawing the logo with the Makie.jl package, and using Colors.jl to get the Julia colors. Rendering is done to a vector graphics format so we use CairoMakie as the backend.
using Makie, CairoMakie
using Colors
using MakieTeX

import Colors: JULIA_LOGO_COLORS
JULIA_LOGO_COLORS
(red = RGB{N0f8}(0.796,0.235,0.2), green = RGB{N0f8}(0.22,0.596,0.149), blue = RGB{N0f8}(0.251,0.388,0.847), purple = RGB{N0f8}(0.584,0.345,0.698))We want to create a rectangle with the right aspect ratio, this should do.
bounding_rectangle = Rect2f(0, 0, 15, 10)GeometryBasics.HyperRectangle{2, Float32}(Float32[0.0, 0.0], Float32[15.0, 10.0])Then, we create a geometry which is that rectangle, but with its corners rounded.
frame = Makie.roundedrectvertices(bounding_rectangle, 2, 50)
# This function returns an unclosed vector of points (points[begin] != points[end]),
# so we need to close it.
push!(frame, frame[begin])
lines(frame; color = 1:length(frame))
Plotting
Now, we can start with the plotting! First
fig = Figure(; figure_padding = 0)
ax = Axis(fig[1, 1])
frameplot = poly!(ax, frame; color = :transparent, strokecolor = JULIA_LOGO_COLORS.purple, strokewidth = 2)
frameplot.strokewidth = 10
fig

titleplot = text!(ax, "OhMyCards is AWESOME"; color = JULIA_LOGO_COLORS.green, fontsize = 15, font = "/Users/anshul/downloads/anquietas.ttf")
titleplot.font =  "/Users/anshul/downloads/anquietas.ttf"
titleplot.fontsize = 55
titleplot.position = (1.5, 1.5)
fig
Now, we sample points within the frame polygon, to get a cool background.
import GeometryOps as GO, GeoInterface as GI
frame_poly = GI.Polygon([GI.LineString(frame)])
points = map(1:500) do _
    point = Point2f(rand(0..15), rand(0..10))
    if GO.contains(frame_poly, point)
        return point
    end
end
magnitudes = rand(10..100, length(points))
500-element Vector{Float64}:
52.87245978915731
91.12897236426247
51.04925065129933
96.3290785854824
86.90741504881804
84.41402390883854
68.0795180227962
32.222296922988846
62.49184980808034
32.97384320397402
⋮
16.72148978389226
98.88637588342537
57.951630513860565
20.540305912543104
96.46571289943165
32.02865044140688
76.85507543029182
49.54642202393043
85.92382543363433scatter!(ax, points; color = rand(length(points)), markersize = magnitudes, colormap = :divergingbwr4095c42_n256, alpha = 0.1)
fig
hidedecorations!(ax)
hidespines!(ax)
tightlimits!(ax)

titleplot[1][] = "🄾🅷 🄼🆈 🅲🅰🆁🅳🆂"
titleplot[1][] = "Ⓞⓗ Ⓜⓨ ⓒⓐⓡⓓⓢ"
titleplot[1][] = "□□ □□ □□□□□"
ax.scene.plots[end].alpha[] = 0.2
translate!(titleplot, 0, 0, 1)
fig
ax.backgroundcolor = :transparent
fig.scene.backgroundcolor[] = RGBAf(1,1,1,0)
fig
This page was generated using Literate.jl.